
Coverage is a set of modeled receiver samples, not a photograph of future performance. Read the map together with its metric, legend, receiver assumptions, band, and solver diagnostics.
Select a scenario
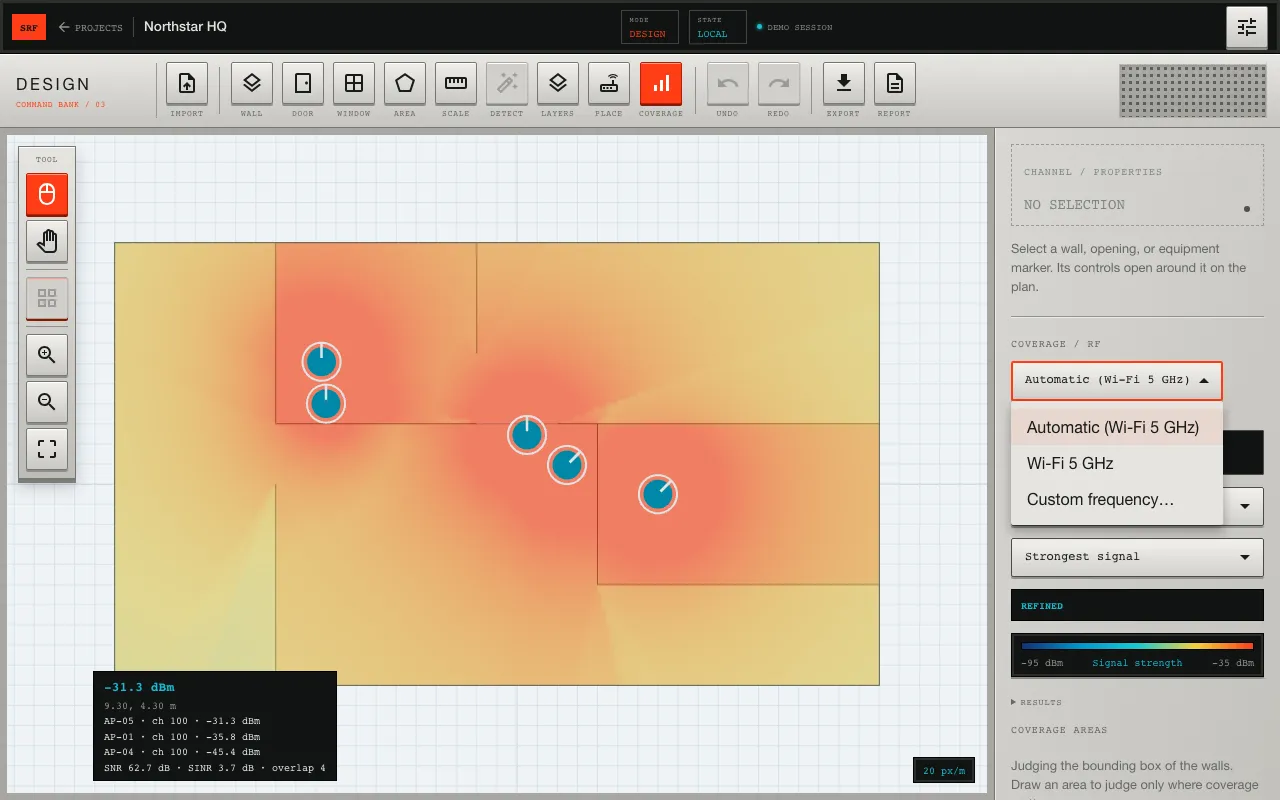
Choose a band family or a custom frequency. SiteRF resolves every enabled, compatible radio for that scenario and explains why any radio cannot be simulated. The path-loss model is selected from the protocol and frequency, while walls and openings contribute explicit losses.
Start with signal strength
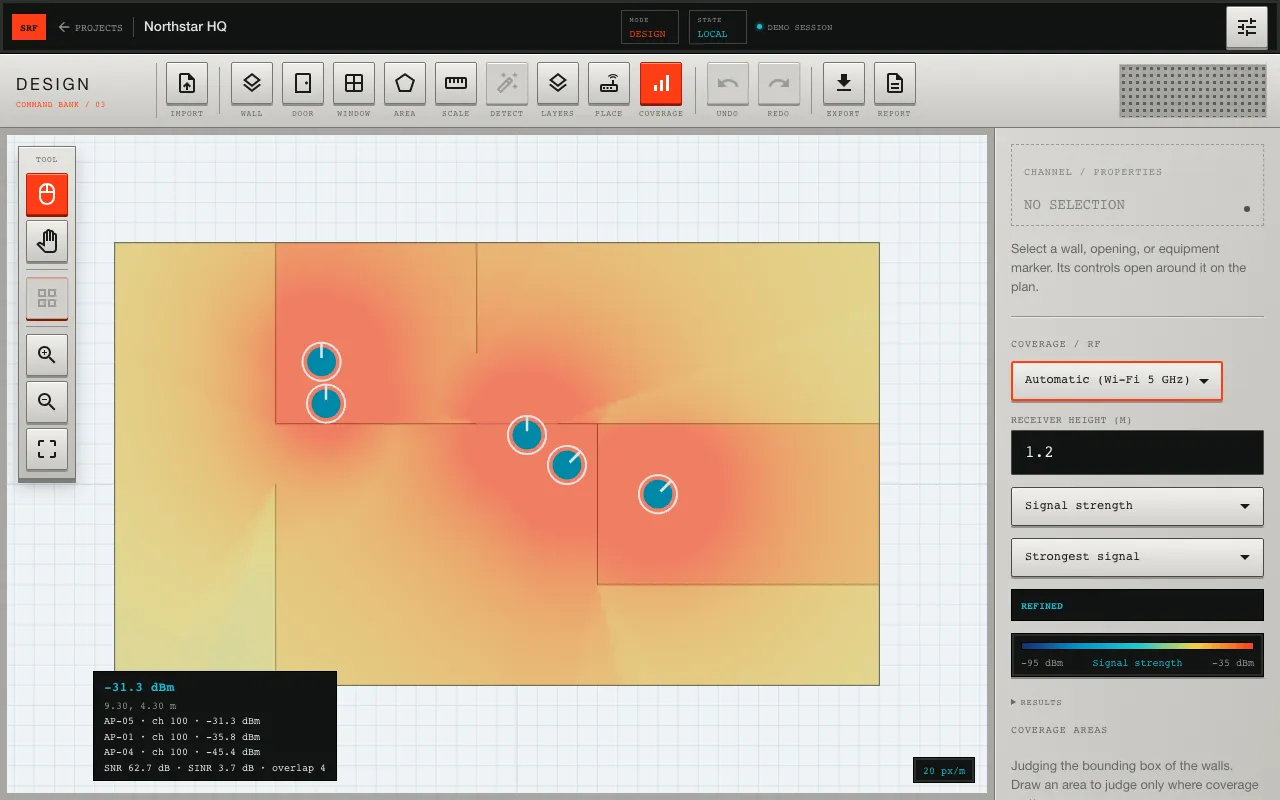
Signal strength shows the strongest received channel power at each sample in dBm. Values closer to zero are stronger: −50 dBm is stronger than −70 dBm. The legend defines the color range; cells below the display floor are not evidence of exactly zero energy.
Add receiver context
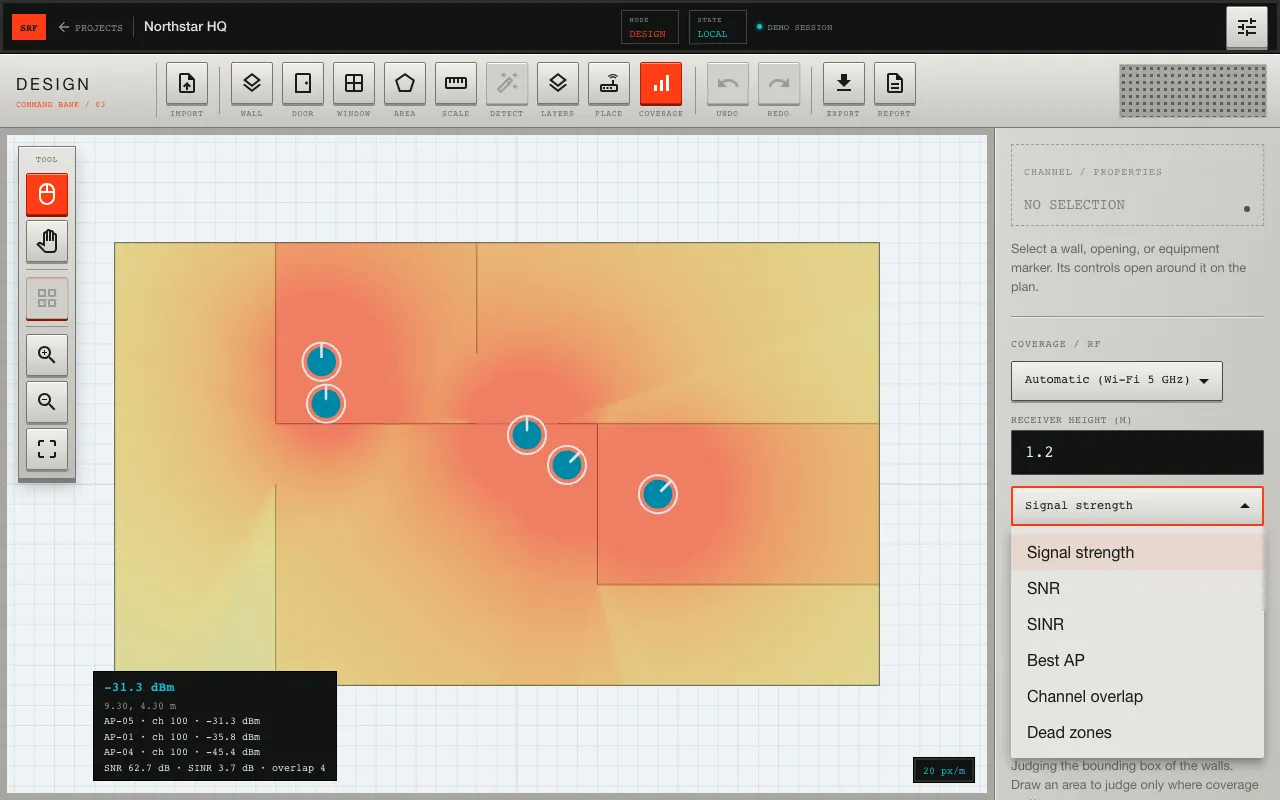
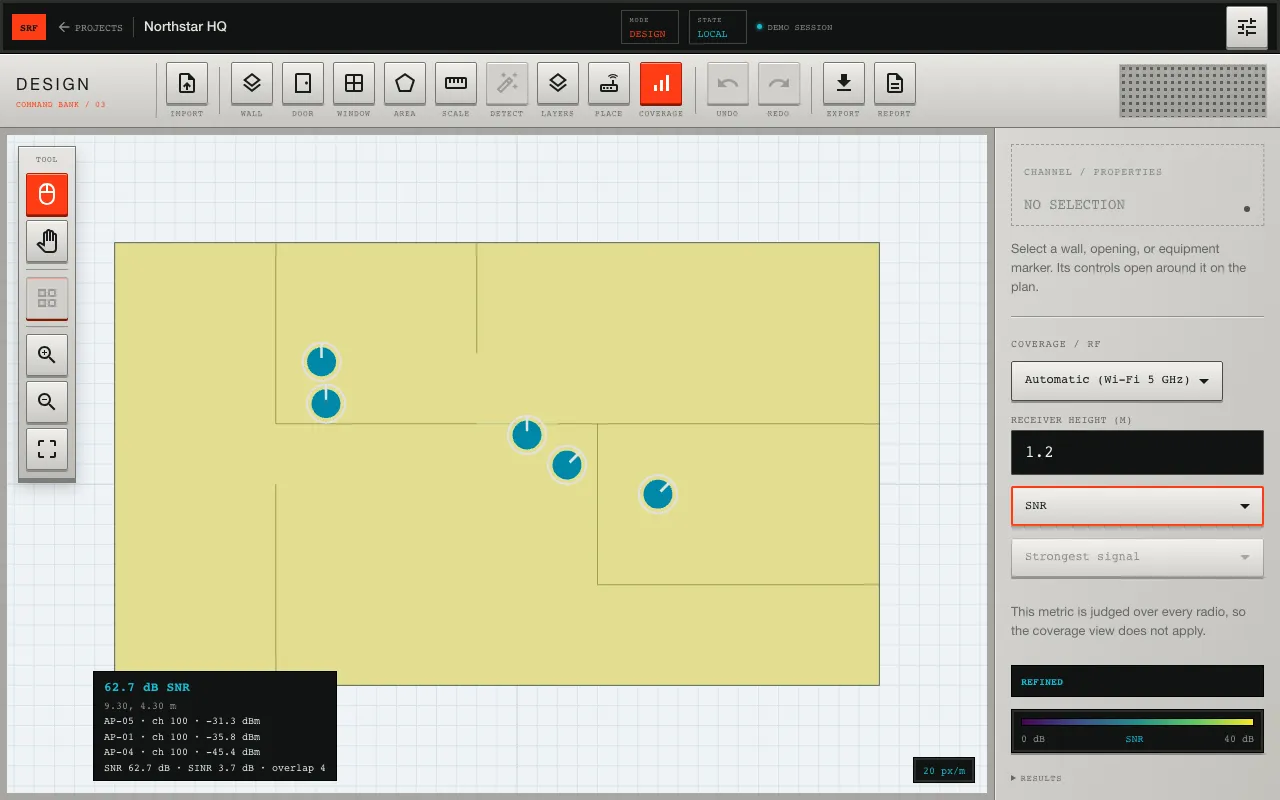
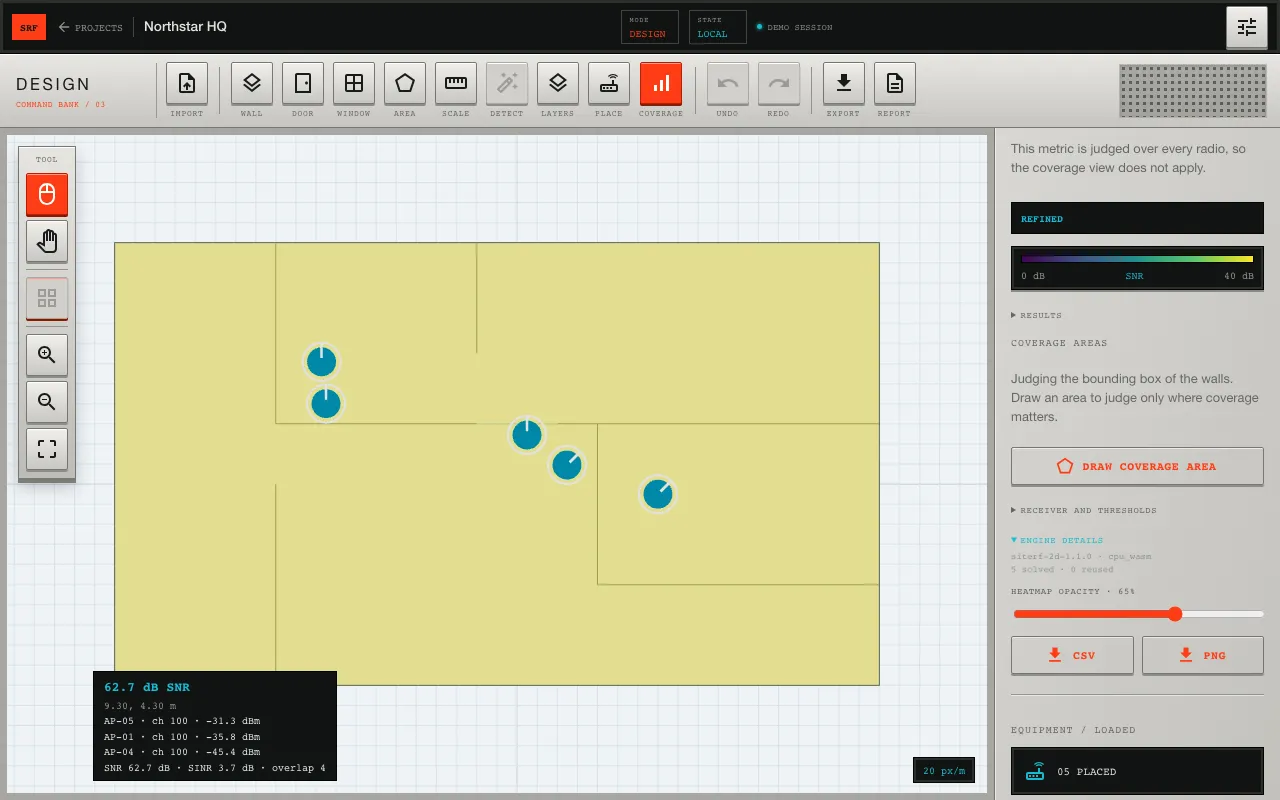
SNR compares the serving signal with the configured receiver noise. SINR additionally accounts for co-channel transmitters represented by the scenario. Both depend on bandwidth and receiver assumptions. Do not compare two SNR maps unless those inputs are consistent.
Overlap identifies how many additional radios reach a sample on the same channel. Overlap can support roaming while excessive co-channel overlap can reduce usable airtime. The useful amount depends on the WLAN or radio design, not on a universal color target.
Dead zones apply the configured threshold inside defined coverage areas. A dead-zone map is only as meaningful as its threshold and polygon. Confirm both before using the percentage in a report.
Inspect diagnostics
SiteRF reports the path-loss model, calculation quality, timing, and paths evaluated outside a model’s stated range. An out-of-range count means the formula was extrapolated; it does not mean the browser failed. Decide whether the result is still appropriate for the planning question.
Validate the result
Check that walls remain visible, equipment positions are correct, the receiver height matches the intended device, and the selected metric uses the units shown in the legend. Compare multiple bands separately. Before installation acceptance, perform a survey or other field measurement and reconcile meaningful differences.
For a deeper explanation, read How to read RF coverage heatmaps. When the result is ready to communicate, continue to Export client-ready reports.